BetterMind Software
An Easy Way for Healthcare Practitioners to Administer Questionnaires to Clients


Make it easy for Healthcare Practitioners


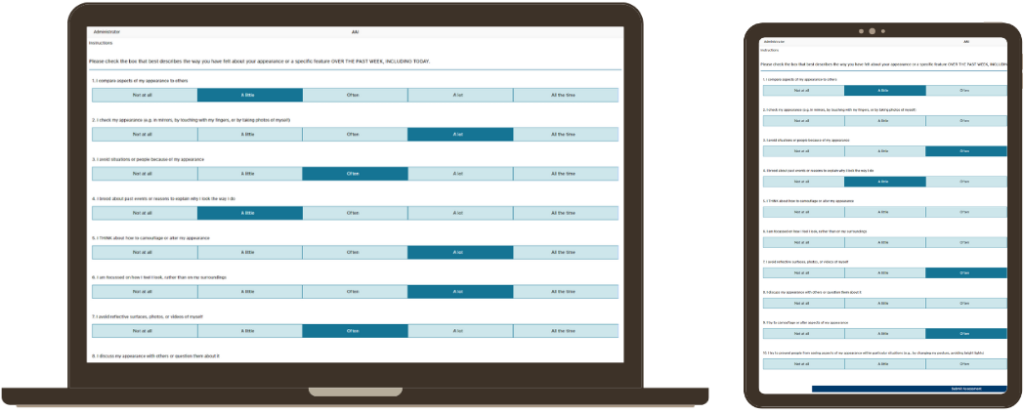
BetterMind Software is designed to make it easy for qualified healthcare practitioners to deliver outcome assessments to their clients. Assessments are delivered at the point of care or remotely using a computer, laptop or other portable electronic device.
Assessments Available
To Track Outcomes and Inform Treatment for Mental Health Services, Psychologists, Psychiatrists, Counselors and Other Qualified Mental Health Providers
Try it and see how BetterMind can enhance your practice

Serving to 199 + Hospital


BetterMind
Software Features
BetterMind Software allows you to send assessments by email. Clients can answer questionnaires on any web-enabled device in your waiting room or office or at home.
BetterMind Software allows you to schedule regular assessments for your clients to complete at home to remotely monitor symptoms. Schedule follow-up assessments weekly, monthly, or quarterly...
Solicit feedback after a session or once the episode of care has ended. Engage in feedback informed practice and learn what is working for clients in therapy and what isn’t.
BetterMind Software operates on computers, laptops, or tablets using popular operating systems such as android, Chrome, Internet Explorer, and others.
BetterMind
Administer assessment, Receive Reports, phycologist, psychiatrist and counselors

Watch a Demo of the Better
Mind Software
Take a tour of the BetterMind Software and see how it can enhance your practice.
Optimizing Clinical Practice with
BetterMind Software

Pyschiometric
Assessment


Instant
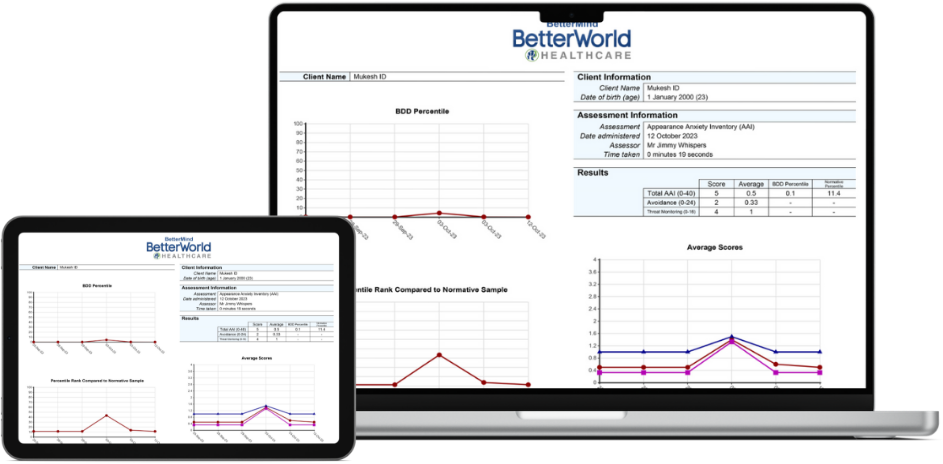
Scoring

Graph

Schedule
Assessment

Percentiles
Why BetterMind?
-
Easy For Patients
No pencil or paper required. Patients easily complete the assessments by tapping the multi-choice screen to enter their answers.
-
Designed For Practitioners
Clinicians no longer need to manually score psychometric assessments. BetterMind automatically scores assessments and quickly provides accurate reports.
-
Efficient And Accurate
Providers can deliver these assessments in the office or remotely in a timely and secure manner.
Have a Question?
Lets Connect
Have a Question? Lets Connect
Start Trial for BetterMind Software
Your account will get you access to BetterMind’s features, assessments, metrics, score and graphing function.
We know you will like BetterMind because it was built with the professional healthcare practitioners, like you, in mind. Try it and see how BetterMind can enhance your practice.
Support
Frequently Asked Questions
You’ve got questions, we’ve got answers. Below you can find answers to some of the most frequently asked questions. If you can’t find the answer you’re looking for, please feel free to reach out to us at info@betterworldhealthcare.com.


