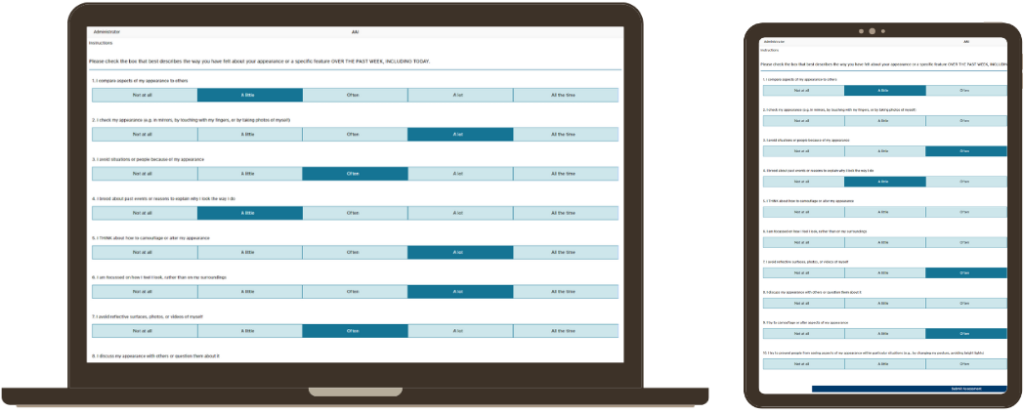


BetterMind Software allows you to send assessments by email. Clients can answer questionnaires on any web-enabled device in your waiting room or office or at home.
BetterMind Software allows you to schedule regular assessments for your clients to complete at home to remotely monitor symptoms. Schedule follow-up assessments weekly, monthly, or quarterly...
Solicit feedback after a session or once the episode of care has ended. Engage in feedback informed practice and learn what is working for clients in therapy and what isn’t.
BetterMind Software operates on computers, laptops, or tablets using popular operating systems such as android, Chrome, Internet Explorer, and others.

Pyschiometric
Assessment

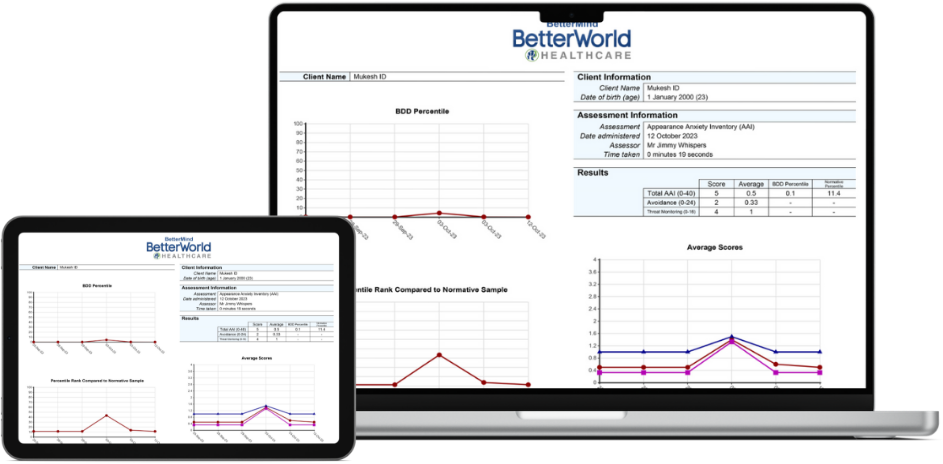
Instant
Scoring

Graph
Schedule
Assessment
Percentiles